July 24, 2026 · OcclusionOS
The Unexplained Collection Slip: Why You Can't Explain a $20k Dip (and Your Office Manager Can't Either)
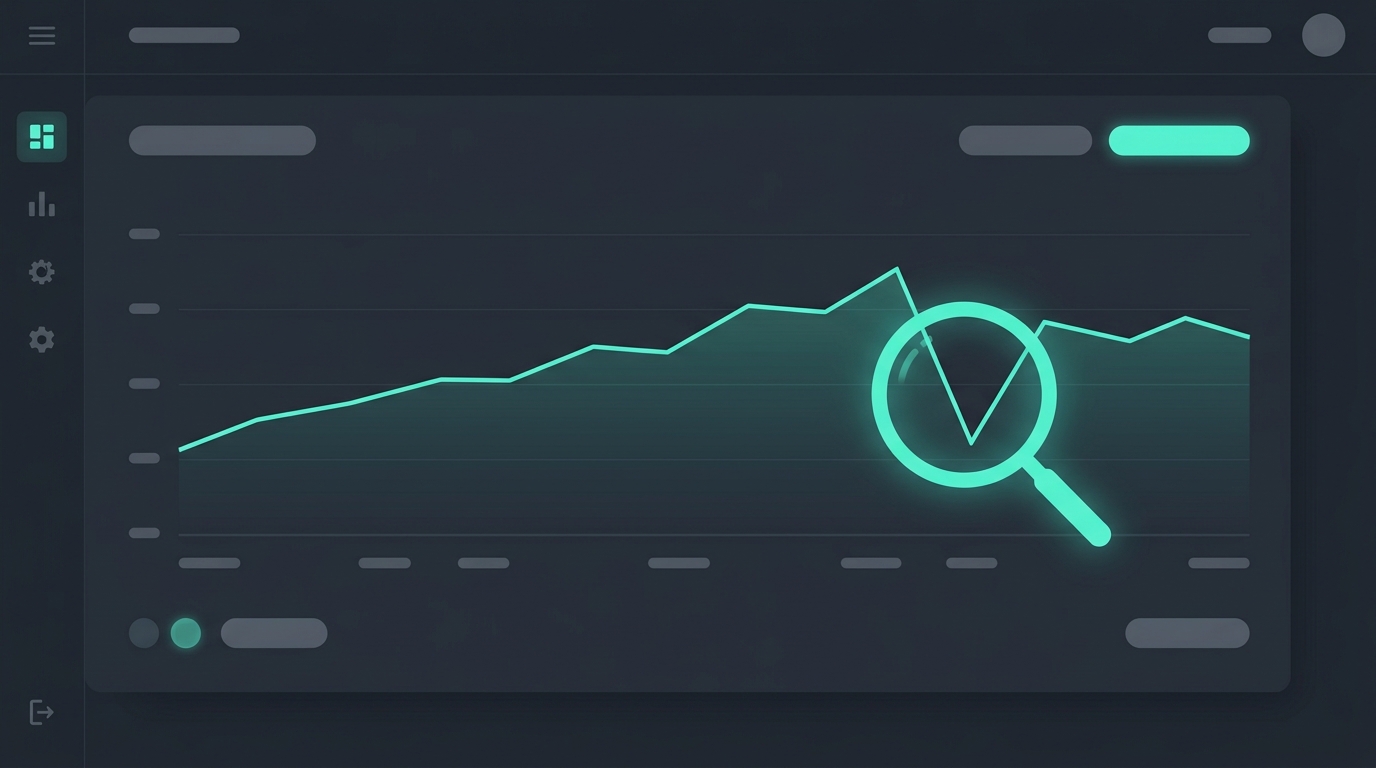
For years, your clinical instincts have been your greatest asset. They built your reputation, filled your chairs, and carried you to multiple locations. But lately those instincts have hit a ceiling, and the proof shows up on Sunday night: hunched over a laptop, stitching exported CSVs into a spreadsheet.
The clinical side feels like it is humming. The spreadsheet says otherwise. Collections at one location are down $20,000, and the dip does not correlate with provider production or schedule density. Everyone is busy, the chairs are full, the team is exhausted. Your take-home is flat. That is the trap: busy is a vanity metric that hides systemic profit leaks. Clinical instinct is a superpower for one office and a liability across a group.
Why native PMS reports cannot answer the question
Practice management systems were built for clinical documentation and individual patient billing, not as business intelligence engines for a multi-location group. When you move from management by walking around to managing by data, native reports leave you flying blind.
OpenDental is a robust tool, but it carries a real SQL gap. The software ships with over 1,400 prebuilt queries, largely inaccessible to an owner-dentist whose primary focus is the chair. Getting answers out of the MySQL or MariaDB backend takes technical expertise you do not have time to acquire, and without rolling those queries up across locations, you are left with fragmented snapshots of the past instead of a view of where your money is going.
The office manager's dilemma
Even a sharp, dedicated office manager cannot give you diagnostic answers while triaging staffing holes and running the daily huddle. When you ask why collections are down, she is trapped inside the same snapshot data you are, with no view of enterprise-wide trends in provider production versus collections. She is navigating with a compass when four offices require radar.
So the burden lands back on you, the de facto CEO, every weekend. And the stakes are not abstract. In dentistry, the game is pushing overhead under the 60% benchmark. When $20,000 disappears from collections, it is precisely the margin that separates a clinician's draw from real profit distributions. Miss it often enough and you are running a high-stress non-profit for your landlords and suppliers, with none of the profit you could be taking home.
Demand generation is not the constraint
Before spending another dollar on ads, separate demand generation from operational monetization. You cannot fix a leaky bucket by turning up the faucet. Most agencies will promise a flood of new patients, but un-monetized chair time is the silent killer of group profitability.
Raw patient volume means nothing if your net collections percentage is slipping or your case acceptance percentage sits at 60% when it should be near 80%. You may not need more patients at all. You need to close the gap between a clinical diagnosis and a signed treatment plan. To find the constraint, ask harder questions of your data:
- Patient mix: which locations attract the wrong patients for their clinical strengths, filling chairs with low-margin cleanings instead of high-value cases?
- Hygiene recall leakage: how many active patients at the affected location are unappointed and sliding toward inactive? A full schedule with flat profit almost always traces back to this gap.
- Intake friction: is the constraint the trade area itself, or a front desk that cannot clear the nut because calls and scheduling are leaking?
True growth follows the Pareto Principle: roughly 20% of patients drive 80% of high-value production. The growth you are hunting is rarely in new patients. It is in the diagnosed, unscheduled treatment already sitting in your charts, often six figures of it across a group. A quiet office focused on high-margin restorative work will outperform a busy office that is over-scheduled and under-monetized.
Map the economic reality of each location
A generic plan fails a multi-location group because it ignores each office's trade area. What works for an urban office will not work for a suburban one, especially when the DSO next door is using automated analytics to cherry-pick your highest-value cases.
Instead, set growth bands grounded in market research and location-specific chair capacity. A growth band tells you that an office at 90% capacity with weak collections does not have a marketing problem; it has a provider production problem. Bands keep your forecasts honest and your spending pointed at the real constraint.
Then treat growth as one connected system: marketing that attracts high-value patients, intake that converts the call to a chair, scheduling that maximizes provider production, case acceptance that moves patients from "let me think about it" to "let's start," and care continuity that pre-appoints patients before they leave. If one link fails, hygiene recall being the usual suspect, the whole system's profitability sags, and you get a $20,000 dip nobody can explain.
The shift from clinician to entrepreneur means trading "how do we get more patients?" for "where is growth actually constrained?" Your clinical excellence built the group. Protecting it takes a data infrastructure that surfaces the specific dollars left on the table, in unscheduled treatment, lapsed recall, and weak case acceptance, so you can stop flying blind.
OcclusionOS helps multi-location dental practices diagnose where growth is actually constrained, from patient economics and trade-area opportunity to intake, care continuity, KPI architecture, and location-specific strategy. If you are ready to replace gut-feel growth with a data-infused operating framework, start with OcclusionOS.