August 18, 2026 · OcclusionOS
Stop Juggling Vendors: Why Your Marketing Agency and Your Dashboard Should Be the Same Conversation
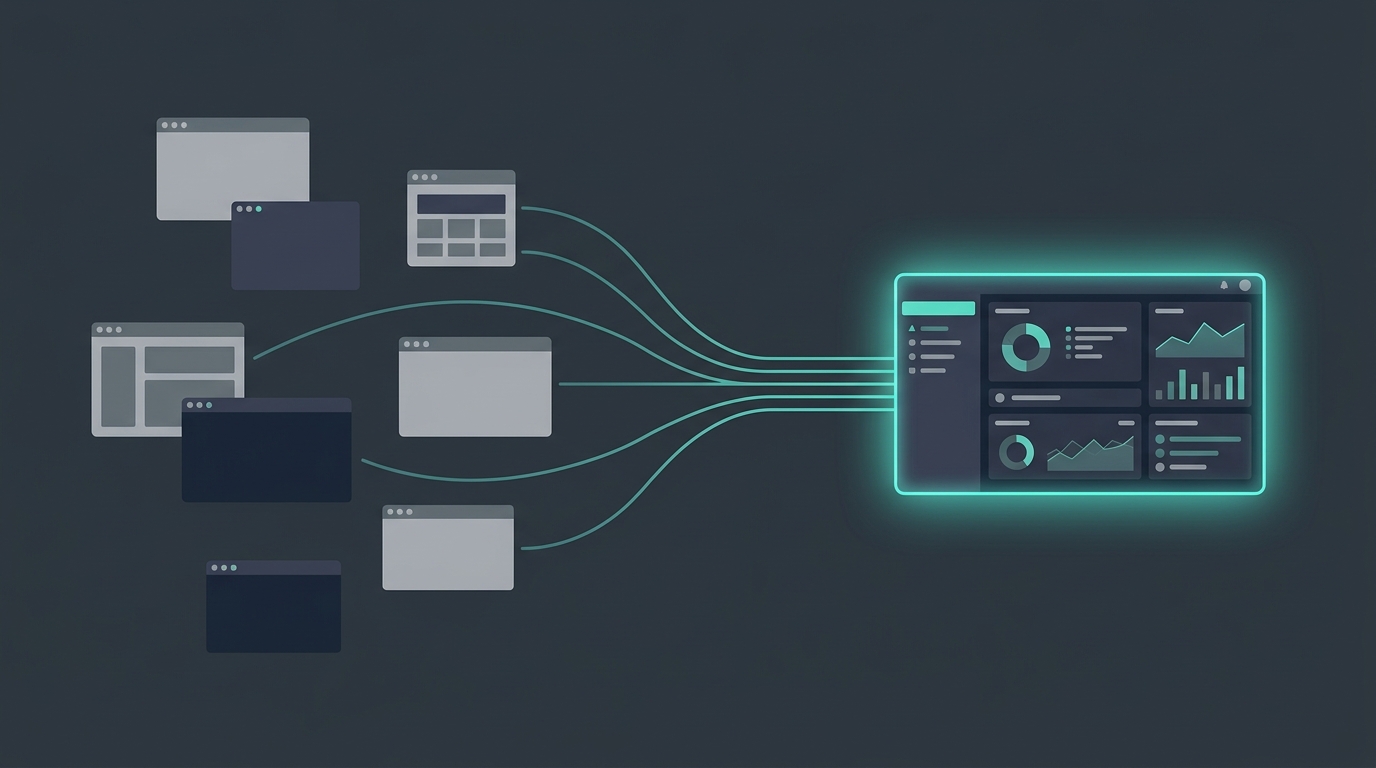
It is Sunday night, and the workweek has already started. You are at the kitchen table with four OpenDental reports open on your laptop, plus a master spreadsheet you have spent two hours rebuilding by hand. You are trying to answer one question: why is one office thriving while another feels quiet, even though its schedule is full?
The reflex when collections dip is to "do more marketing." You call an agency, they promise more volume, you sign a contract and hope. But for a clinically sophisticated owner, growth is not a volume problem. It is a diagnostic problem. If you cannot see where value leaks between the first click and the final collection in your ledger, you are not growing. You are just raising your overhead.
Vanity metrics vs owner economics
Most agencies live in a world of clicks, calls, and colorful PDF reports. Those numbers can look impressive while staying completely disconnected from your clinical ledger. If you have been burned before, you already know the feeling: the report says the campaign is winning while your net collections percentage says otherwise.
Worse, high call volume can actively hurt you if it brings the wrong patient mix. A front desk flooded with price shoppers and low-margin emergency visits clogs the schedule and crowds out high-value treatment. Here is the translation table between what agencies report and what actually pays you:
| Agency metric | Owner economics | Healthy target |
|---|---|---|
| Cost per new patient call | Hygiene recall reappointment | 90 percent or better |
| Raw call volume | Net collections percentage | 95 to 99 percent |
| Clicks and ad reach | Case acceptance percentage | 75 to 85 percent |
| Cost per click | Provider production per day | Tracked daily, by provider |
When marketing lives in a vacuum, a busy schedule masks operational constraints. You might be clearing the nut every month, but if campaigns keep driving patients who no-show or decline treatment, your profit distributions are the first casualty.
Every location leaks differently
A generic, group-wide marketing plan is a recipe for wasted spend, because every location has a different trade area and a different internal constraint. Your urban office might be pulling patients from the wrong ZIP codes. Your suburban office might be losing the same dollars to front-desk intake or a slip in provider production.
Consider the busy but under-monetized office. Every chair is full, yet production per visit is stagnant. That pattern usually hides a care continuity failure: hygiene is pre-booking at 90 percent while unscheduled treatment sits in your charts by the hundreds of thousands.
Current reporting rarely catches any of this. OpenDental's MySQL backend and its user query layer demand technical skills most office managers, and nearly all marketing agencies, do not have. Without one view that bridges the clinical database and the marketing spend, you cannot tell whether an office is lagging because the ads are weak or because case acceptance has dropped to 55 percent, well below the 75 to 85 percent range of a healthy practice. Diagnosis must precede prescription.
Conversion is not monetization
The patient journey is one connected system, not a series of hand-offs. A marketing win becomes a business loss the moment there is an intake gap. Spend money to attract a $5,000 implant case, then let the front desk book it as a limited exam inside a high-production doctor block, and the campaign has been cannibalized by your own operations.
Data fidelity means seeing the whole chain: which campaign produced the treatment plan, how much of that plan was accepted, and, most important, how much was actually collected. That visibility is impossible when the marketing people and the data people work in different buildings and answer to different contracts.
One vendor, one set of incentives
In the traditional model, when collections slip, the agency blames the front desk's call handling and the dashboard vendor points to market conditions. The finger-pointing is not bad faith. It is the natural output of fragmented systems, because no single vendor owns the outcome.
Integrated growth removes that friction. When demand generation and demand capture sit under one roof, the only scoreboard left is the one you care about: overhead moving toward the 60 percent benchmark, and profit you could be taking home.
Integration also produces realistic growth bands instead of inflated promises. Forecasts built from your actual chair utilization and provider capacity will never sound as exciting as a salesperson's imagination. They will, however, come true.
The shift from solo practitioner to multi-location owner is a shift in the question you ask. Stop asking how to get more calls and start asking where the next dollar of spend earns the highest return. The goal is not a prettier dashboard for Sunday nights. It is higher take-home pay, lower overhead, and a stronger enterprise value for the day you choose to exit. Instinct built your first offices. One unified view of marketing and money protects the group you have built.
OcclusionOS helps multi-location dental practices diagnose where growth is actually constrained, from patient economics and trade-area opportunity to intake, care continuity, KPI architecture, and location-specific strategy. If you are ready to replace gut-feel growth with a data-infused operating framework, start with OcclusionOS.